As part of its commitment to transparency and accountability, CATSA publishes key performance indicators (KPIs) that reflect operational efficiency, service standards, and screening volumes.
Most KPIs are published quarterly, with select metrics, such as passenger volumes and wait time service levels, featuring monthly results within those updates. Workforce demographics are updated annually. Each KPI includes its update frequency and the most recent reporting period.
Screening Performance: Q4 2025-26 (January-March)
Last update: April 23, 2026
Wait Time Service Levels
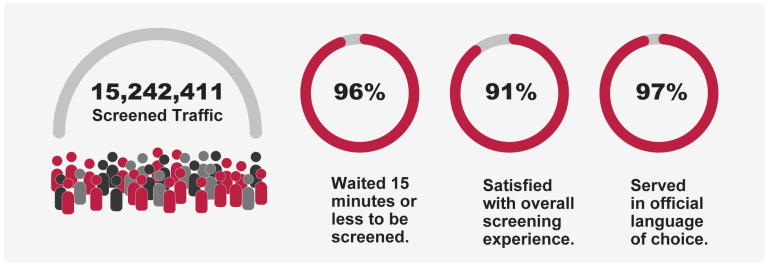
Percentage of passengers who waited less than 15 minutes to be screened at designated airports with Boarding Pass Security System (BPSS) technology.
Screened Traffic
Total number of passengers and non-passengers screened at designated airports with Boarding Pass Security System (BPSS) technology.
Complaints
Number of formal complaints received per 100,000 passengers screened at designated Canadian airports.
4.57 complaints
Per 100,000 passengers
Passenger Experience: Q4 2025-26 (January-March)
Last update: April 23, 2026
Overall Experience
Percentage of passengers who reported being satisfied or very satisfied with their overall security screening experience at Class 1 airports.
91%
Official Languages
Percentage of passengers who were served in the official language of their choice, English or French, at the screening checkpoint at Class 1 airports.
97%
Passenger Assistance
Number of passengers who sought help retrieving personal items forgotten or lost at the screening checkpoint.
3,150
Workforce Representation: 2025-26
Last update: June 8, 2026
CATSA Workforce Demographics
The percentage of a designated group (Women, Indigenous Peoples, Members of Visible Minorities, and Persons with Disabilities) among employees.
| Category | Percentage |
|---|---|
| Women | 44.1% |
| Indigenous peoples | 3.8% |
| Members of visible minorities | 29.8% |
| Persons with disabilities | 7.7% |
Screening Officer Demographics
The percentage of a designated group (Women, Indigenous Peoples, Members of Visible Minorities, and Persons with Disabilities) among the screening officer workforce.
| Category | Percentage |
|---|---|
| Women | 48.6% |
| Indigenous peoples | 1.2% |
| Members of visible minorities | 37.2% |
| Persons with disabilities | 0.9% |
Wait Time Service Level Details
| Airport | 2026 Jan | 2026 Feb | 2026 Mar | Total |
|---|---|---|---|---|
| YEG: Edmonton International Airport | 93.9% | 90.1% | 95.3% | 93.2% |
| YHZ: Halifax Stanfield International Airport | 99.3% | 99.1% | 98.6% | 99.0% |
| YOW: Ottawa Macdonald-Cartier International Airport | 98.7% | 98.6% | 99.0% | 98.8% |
| YUL: Montréal-Pierre Elliott Trudeau International Airport | 95.8% | 96.4% | 98.3% | 96.8% |
| YVR: Vancouver International Airport | 94.6% | 91.6% | 94.5% | 93.6% |
| YWG: Winnipeg James Armstrong Richardson International Airport | 92.9% | 93.8% | 93.2% | 93.3% |
| YYC: Calgary International Airport | 98.9% | 99.1% | 98.3% | 98.8% |
| YYZ: Toronto Pearson International Airport | 95.0% | 96.2% | 96.8% | 96.0% |
| YLW: Kelowna International Airport | 92.5% | 96.7% | 99.1% | 96.4% |
| YQB: Québec City Jean Lesage International Airport | 98.6% | 99.1% | 99.1% | 98.9% |
| YQR: Regina International Airport | 89.9% | 90.3% | 94.2% | 91.4% |
| YTZ: Billy Bishop Toronto City Airport | 99.3% | 98.1% | 98.5% | 98.7% |
| YXE: Saskatoon John G. Diefenbaker International Airport | 94.5% | 92.8% | 94.0% | 93.8% |
| YYJ: Victoria International Airport | 95.1% | 92.2% | 96.3% | 94.7% |
| YYT: St. John's International Airport | 96.6% | 98.8% | 97.6% | 97.6% |
| YHM: John C. Munro Hamilton International Airport | 99.9% | 99.9% | 99.9% | 99.9% |
| YXX: Abbotsford International Airport | 97.5% | 96.7% | 98.4% | 97.6% |
| All airports/Total | 95.6% | 95.5% | 96.8% | 96.0% |
Screened Traffic Details
| Airport | 2026 Jan | 2026 Feb | 2026 Mar | Total |
|---|---|---|---|---|
| YEG: Edmonton International Airport | 279,707 | 249,481 | 274,811 | 803,999 |
| YHZ: Halifax Stanfield International Airport | 119,298 | 120,229 | 152,078 | 391,605 |
| YOW: Ottawa Macdonald-Cartier International Airport | 199,844 | 193,394 | 204,125 | 597,363 |
| YUL: Montréal-Pierre Elliott Trudeau International Airport | 772,282 | 705,006 | 740,490 | 2,217,778 |
| YVR: Vancouver International Airport | 861,571 | 804,435 | 933,758 | 2,599,764 |
| YWG: Winnipeg James Armstrong Richardson International Airport | 171,152 | 154,172 | 168,935 | 494,259 |
| YYC: Calgary International Airport | 539,586 | 506,552 | 573,180 | 1,619,318 |
| YYZ: Toronto Pearson International Airport | 1,669,659 | 1,545,926 | 1,722,580 | 4,938,165 |
| YLW: Kelowna International Airport | 110,332 | 102,034 | 109,008 | 321,374 |
| YQB: Québec City Jean Lesage International Airport | 86,675 | 75,528 | 78,216 | 240,419 |
| YQR: Regina International Airport | 50,649 | 47,111 | 44,761 | 142,521 |
| YTZ: Billy Bishop Toronto City Airport | 49,905 | 50,594 | 67,889 | 168,388 |
| YXE: Saskatoon John G. Diefenbaker International Airport | 64,391 | 57,522 | 58,794 | 180,707 |
| YYJ: Victoria International Airport | 65,725 | 62,848 | 78,651 | 207,224 |
| YYT: St. John's International Airport | 39,663 | 32,652 | 48,979 | 121,294 |
| YHM: John C. Munro Hamilton International Airport | 21,866 | 20,506 | 23,185 | 65,557 |
| YXX: Abbotsford International Airport | 45,029 | 40,422 | 47,225 | 132,676 |
| All airports/Total | 5,147,334 | 4,768,412 | 5,326,665 | 15,242,411 |
For further details, please visit the Daily Screened Traffic at PBS Checkpoints report. Updated weekly.